Fixed Deposit vs Mutual Funds vs Equity vs Bonds vs Corporate FD: Taxation Simplified In 2025
Introduction
Fixed Deposit vs Mutual Funds vs Equity vs Bonds vs Corporate FD: Taxation Simplified In 2025. When it comes to investing, returns are important — but what really matters is the post-tax return. Many investors focus only on interest rates or market returns and ignore how much tax they finally pay. In this article, we will compare Fixed Deposits (FDs), Mutual Funds, Direct Equity, Bonds, and Corporate FDs under the latest taxation rules (STCG 20% and LTCG 12.5% without indexation).
1. Fixed Deposits (FDs)
Return type: Interest income
Taxation: Interest is taxed every year as per your income tax slab (30% for highest slab).
Effective impact: High tax leakage, especially for investors in higher tax brackets.
Example:
Investment: ₹10,00,000 at 7% for 10 years → Maturity Value = ₹19,67,151
Tax (30% on interest = ₹2,90,145)
Post-tax Value = ₹16,77,006
Return type: Interest income (like bank FDs)
Taxation: Same as FD — taxed every year at slab rates.
Risk factor: Higher default risk compared to banks.
Example:
Investment: ₹10,00,000 at 8% for 10 years → Maturity Value = ₹21,58,925
Tax (30% on interest = ₹3,47,678)
Post-tax Value = ₹18,11,247
3. Bonds
Two types of taxation:
Coupon (interest) – Taxed at slab rate annually.
Capital Gain on Sale – LTCG after 12 months taxed at 12.5% (no indexation).
Example (holding till maturity with coupon):
Investment: ₹10,00,000 at 7% coupon → ₹19,67,151 before tax
Post-tax (30% slab) → ₹16,77,006
Example (selling bond after 10 years with capital gain):
Suppose value grows to ₹19,67,151
Gain = ₹9,67,151, taxed @ 12.5% = ₹1,20,894
Post-tax Value = ₹18,46,257
4. Mutual Funds
- Equity Mutual Funds:
STCG (< 12 months): 20%
LTCG (> 12 months): 12.5% (flat, no indexation)
Growth option = taxation only on redemption.
Example:
Investment: ₹10,00,000 at 12% CAGR for 10 years → ₹31,05,849
Gain = ₹21,05,849, LTCG @ 12.5% = ₹2,63,231
Post-tax Value = ₹28,42,618
- Taxation same as equity mutual funds
STCG (< 12 months): 20%
LTCG (> 12 months): 12.5%
Example:
Investment: ₹10,00,000 at 12% CAGR for 10 years → ₹31,05,849
Tax on gain = ₹2,63,231
Post-tax Value = ₹28,42,618
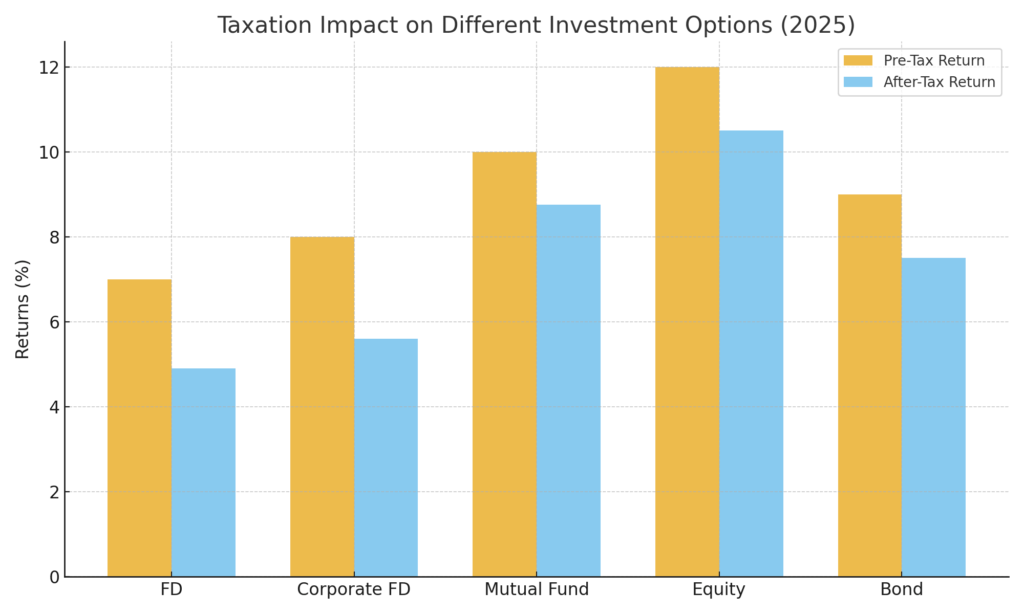
Final Comparison (₹10 lakh for 10 years)
| Investment Option | Before Tax Value | Tax Amount | After Tax Value |
|---|---|---|---|
| Bank FD (7%) | ₹19,67,151 | ₹2,90,145 | ₹16,77,006 |
| Corporate FD (8%) | ₹21,58,925 | ₹3,47,678 | ₹18,11,247 |
| Bonds – Coupon | ₹19,67,151 | ₹2,90,145 | ₹16,77,006 |
| Bonds – LTCG | ₹19,67,151 | ₹1,20,894 | ₹18,46,257 |
| Mutual Funds (12%) | ₹31,05,849 | ₹2,63,231 | ₹28,42,618 |
| Direct Equity (12%) | ₹31,05,849 | ₹2,63,231 | ₹28,42,618 |
📌 Actionable Tips for Investors
- Don’t check portfolio daily during corrections.
- Talk to a financial advisor if confused.
- Stick to your investment plan.
- Rebalance only if goals or risk levels have changed.
Final Thoughts
FDs and Corporate FDs suffer heavily due to yearly taxation at slab rates.
Bonds are better if you book capital gains (LTCG 12.5%) instead of just coupon income.
Equity Mutual Funds and Direct Equity clearly outperform due to compounding + favorable LTCG tax of 12.5%.
For long-term wealth creation, Equity is the most tax-efficient choice.
Always compare after-tax returns, not just interest rates or CAGR. The right tax-efficient product can help you create much higher wealth in the long run.
Disclaimer: Mutual fund investments are subject to market risks. Please consult a financial advisor before investing.
Market conditions change rapidly, and staying informed is crucial. Follow reliable financial news sources, analyse expert opinions, and track regulatory updates. Stay connected with us for more insights on market trends and stock analysis.
📚 Frequently Asked Questions (FAQs)
Disclaimer:
The information provided in this blog is for informational and educational purposes only and should not be construed as financial, investment, or legal advice. Equity investments are subject to market risks, and past performance is not indicative of future results.
This content does not constitute an offer, solicitation, or recommendation to buy or sell any securities, nor does it guarantee any specific financial outcome. Investors should conduct their own research, assess their risk tolerance, and consult with a certified financial advisor or investment professional before making any investment decisions.
The author and publisher of this blog are not liable for any financial losses, decisions, or actions taken based on the information provided. Invest wisely and at your own discretion.